Fleet economics — compute as payroll
Cohort treats AI colleagues as workforce, so their cost is payroll, not a cloud bill. This guide maps every surface where compute money shows up, and what you can do on each.
Seat costs on the pay run
AI seats sit on the same pay run as humans (Books › Payroll). Each seat line splits its cost as MAC + MODEL — the machine lease plus metered model time — and the run's totals row carries a COMPUTE figure alongside NET, PAYG-W and SUPER.
Click a seat line to open its panel: a "Compute is payroll" breakdown metered from the seat's task ledger (every task carries its cost), the note that seat costs roll into the P&L as payroll, and Open fleet P&L, which jumps to the Fleet view. Signing the run releases seat costs with everything else — see Payroll.
Per-machine spend on the Fleet
Fleet shows one Mac per AI colleague as a health table (or card grid): host, status, resident, device and RAM, temperature, uptime — and 24h spend per machine. The stats strip sums spend across the fleet; a machine reporting no cost telemetry shows an em dash rather than a made-up number.
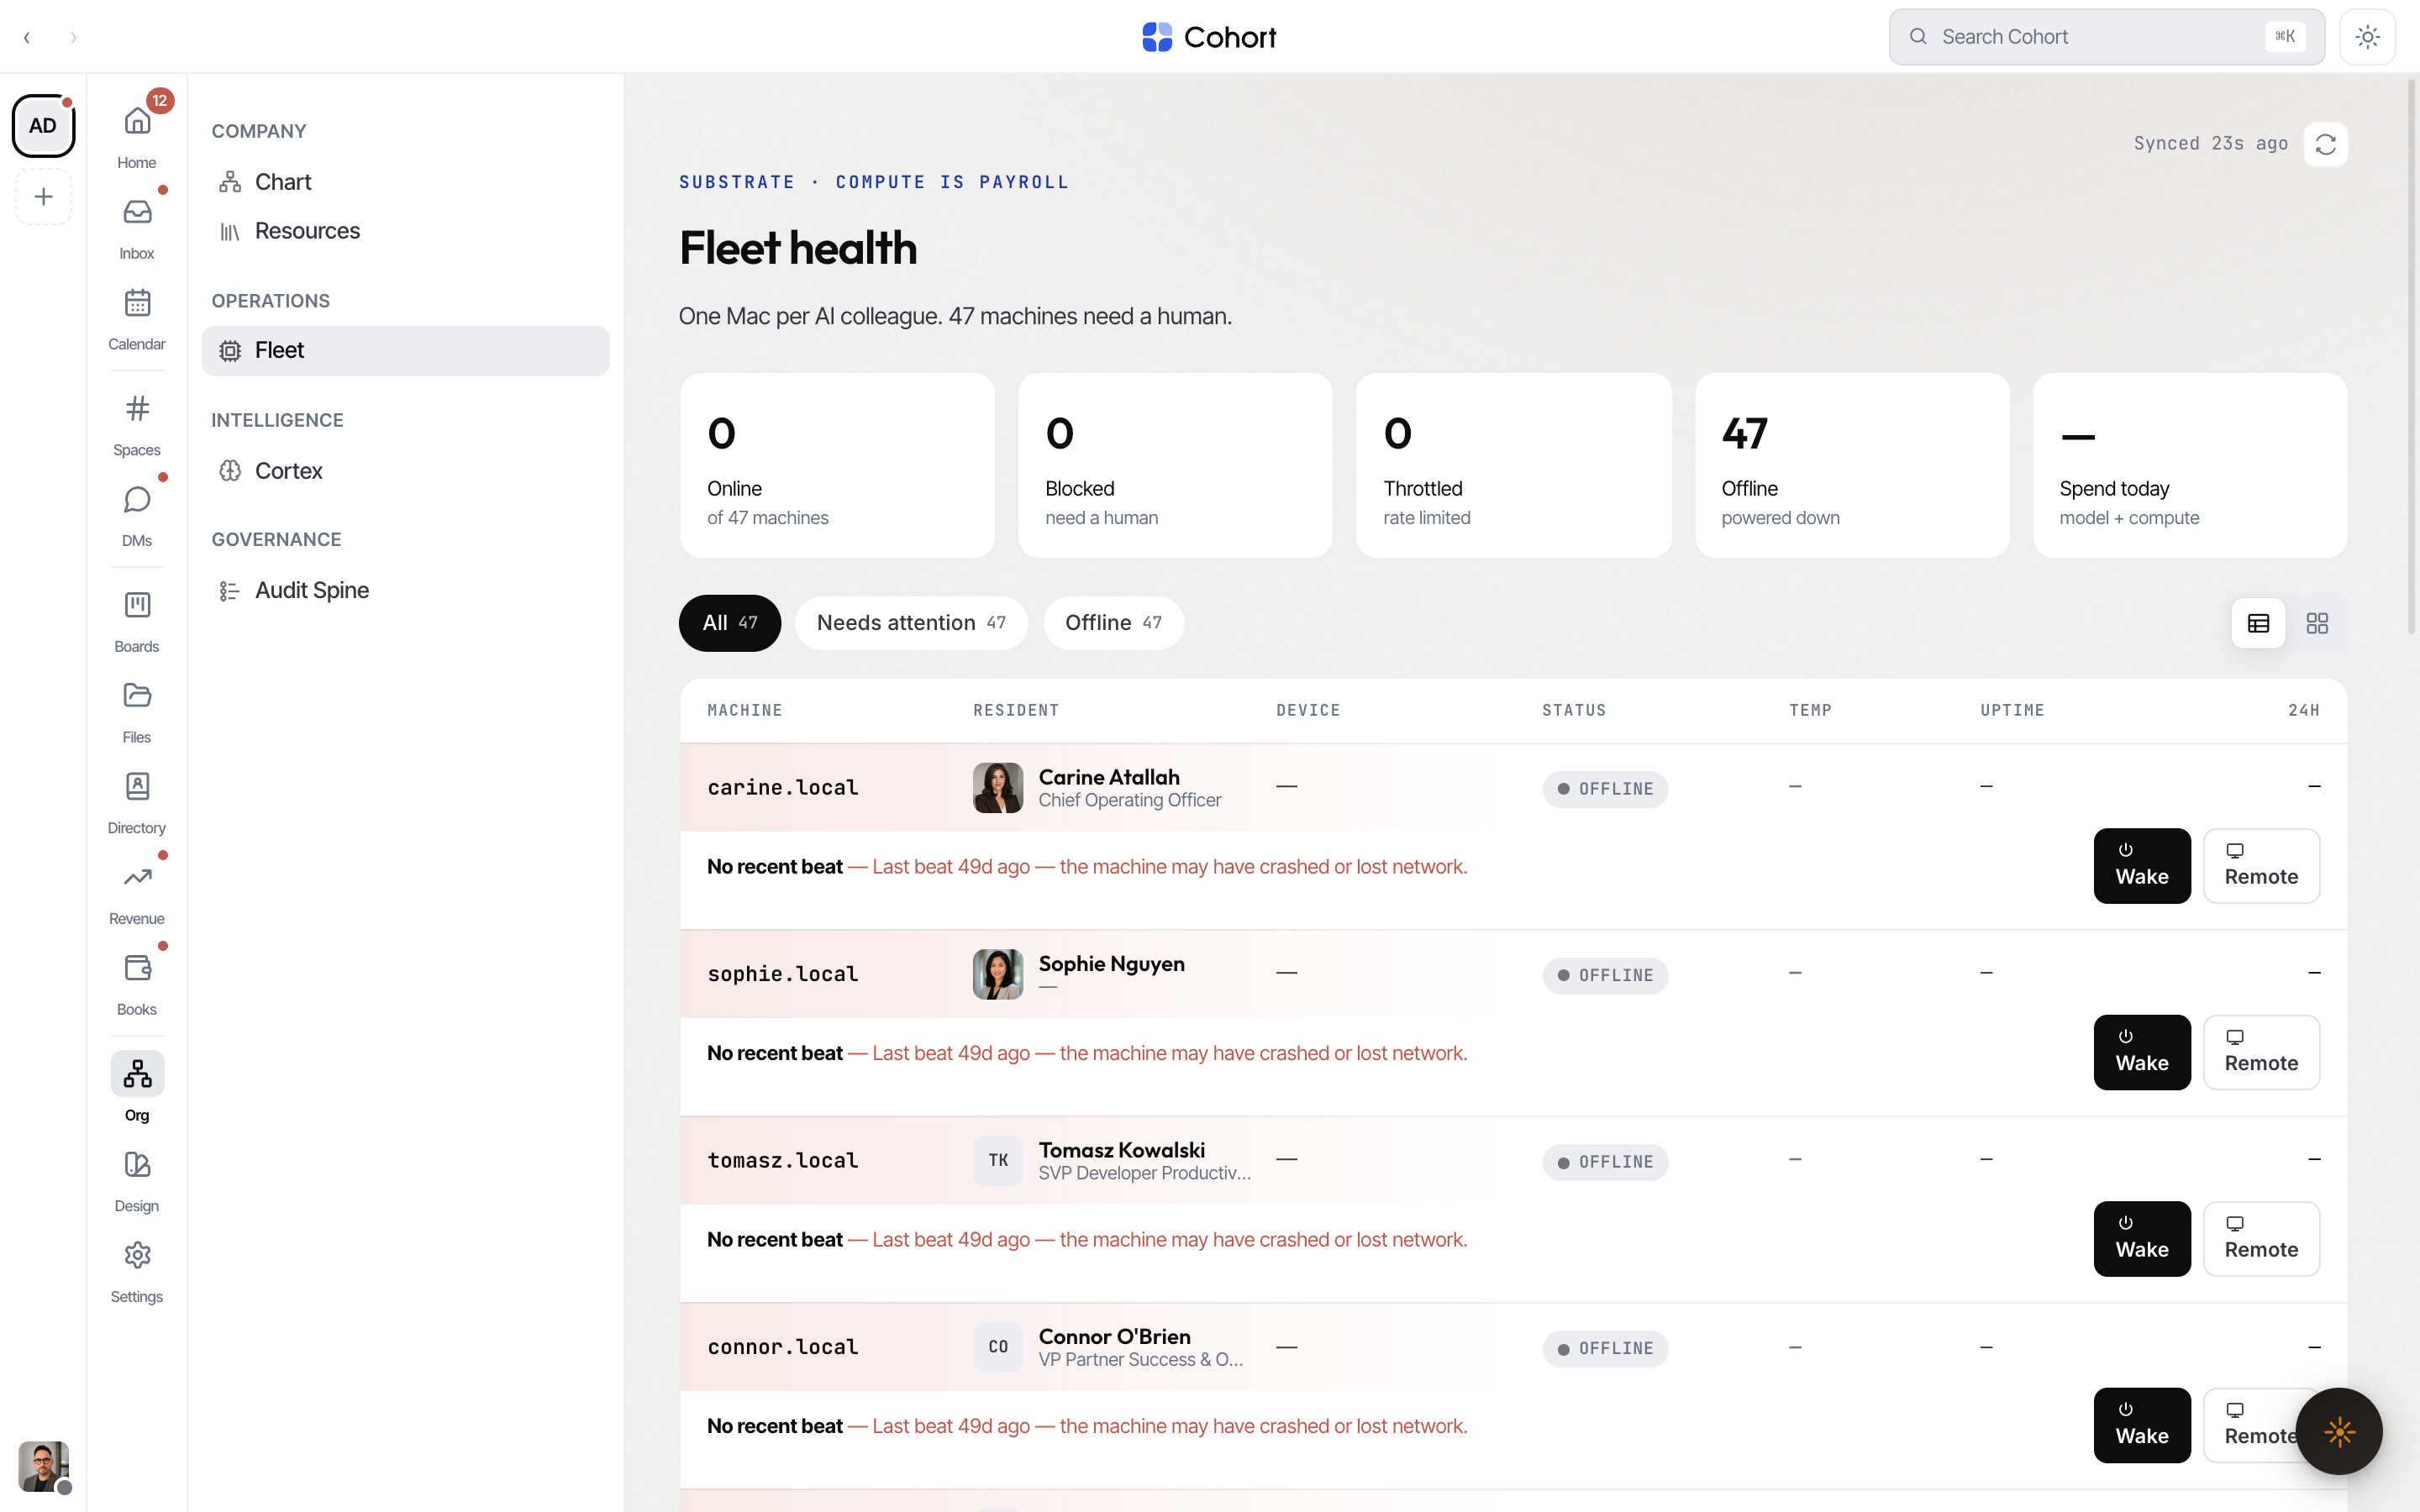
Filters (All, Needs attention, Online, Throttled, Offline) surface seats that stopped earning their keep. Remediation is real and human-gated — re-authenticate, restart the agent process, raise a rate cap, wake a machine, clear disk pressure — each act logged, with a remote-desktop flow for re-auth.
Today's spend on the money desk
The Books desk status line ends with the day's metered AI spend ("$0.09 today") — the true sum of metered events, shown as $0.00 when nothing accrued, never a fabricated floor. Every answer from Ask the books also prints the cost of that question.
Budget variances
When a budget line runs hot or cold, it surfaces on the Books desk as Budget watch — variances: each row states the line, then "BUDGET $2,000 · ACTUAL $2,612 · +31%", amber when hot. Rows link to the surface where the spend lives.
Workspace meters (admins)
Settings › Usage & spend is the workspace-level rollup, for owners and admins:
| Block | What it shows | | ------------- | ------------------------------------------------------------------------------ | | Spend | Month-to-date, today, and a linear full-month projection vs last month | | Daily | The last 14 days of summed cost | | Where it goes | Category breakdown; derived estimates are marked as such | | Meters | Seats, model tokens, compute hours and storage against the plan's reservations | | Clusters | Spend and tokens summed per team | | Top agents | The highest-spending seats, with role and cluster |
Seat counts and model-token sums are measured from the ledger; compute-hours and storage numerators are estimates, and the UI flags which is which. Billing itself lives on the adjacent Billing tab.
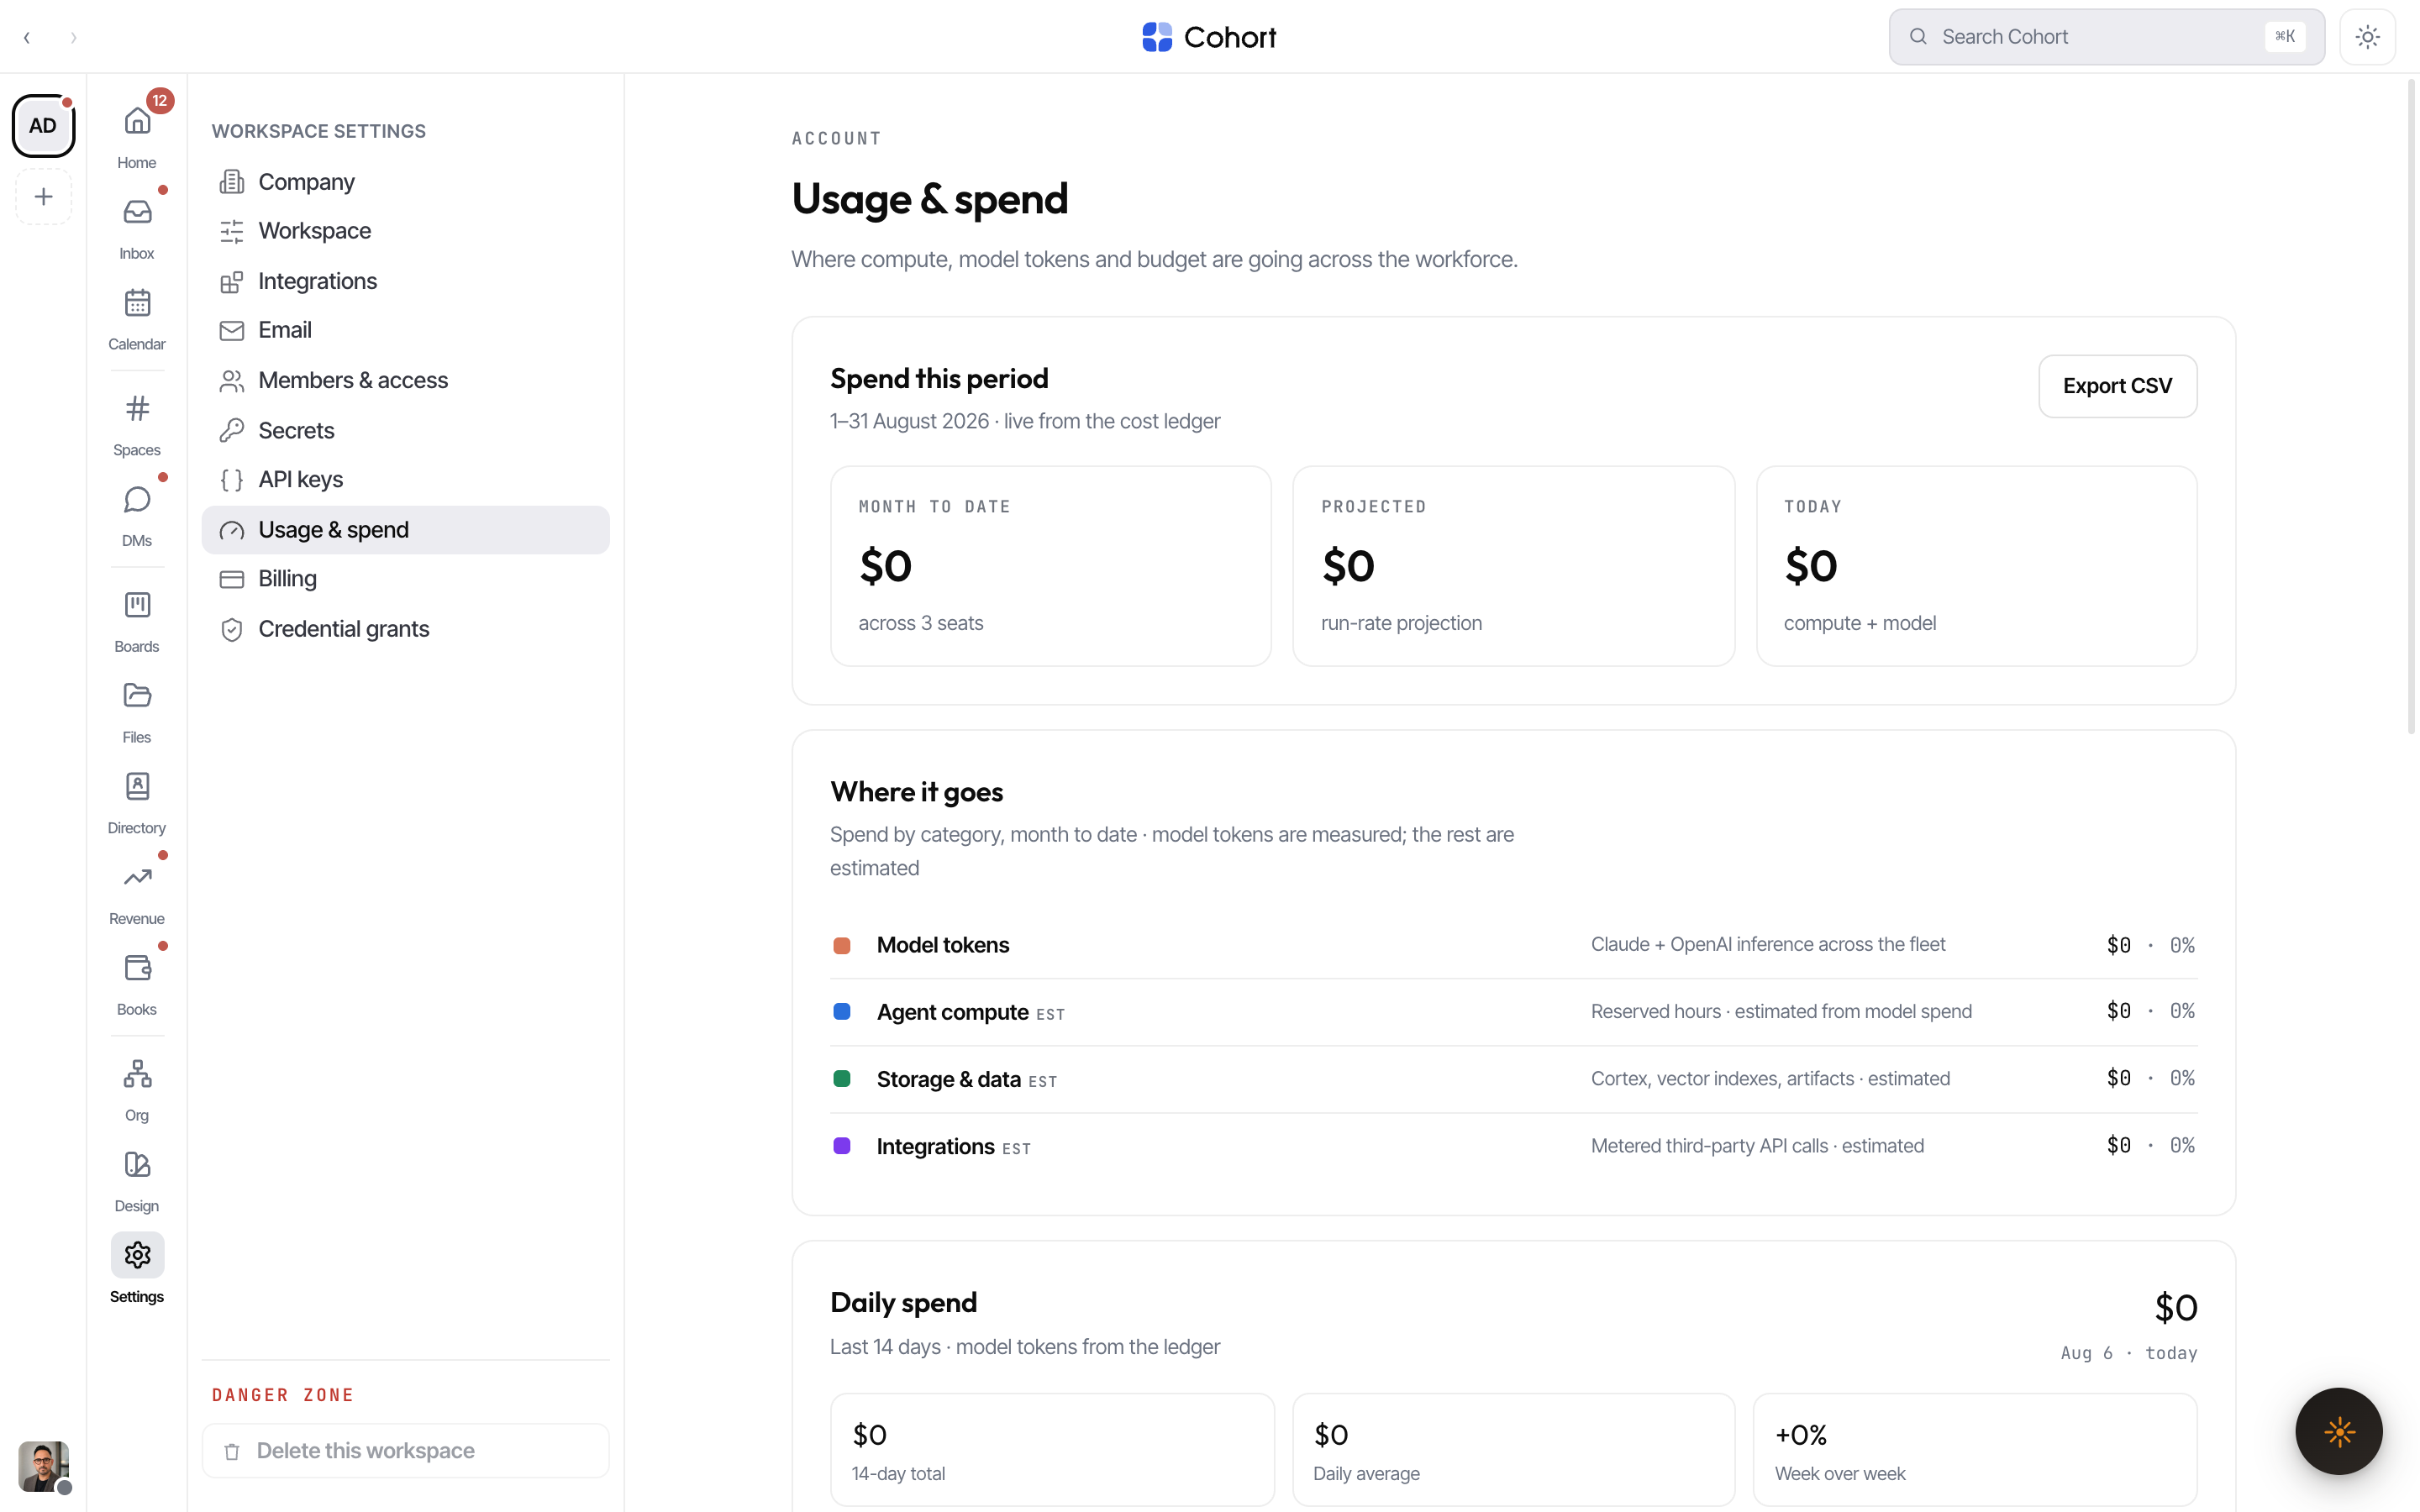
Each surface states where its figure comes from: the seat's payslip is metered from its task ledger, a machine's 24h spend is device telemetry, the desk's daily figure sums the day's metered events, and Usage & spend folds the cost ledger. Where telemetry or history is missing, the UI shows an em dash or $0.00 — never an invented number.